
Reporters need to dig deeper into crime maps to tell the whole story
New research finds that crime maps released by Canadian police forces only paints a partial picture of what is happening.
By H.G. Watson, Associate Editor
You might want to look twice at official police crime maps before you cite them in a story.
New research from a professor at University of Ottawa has found that the maps often do not accurately tell the whole story about crime in a given neighbourhood. The information presented also lacks crucial context needed to make sense of the story, and might only tell one side of it—that of the police.
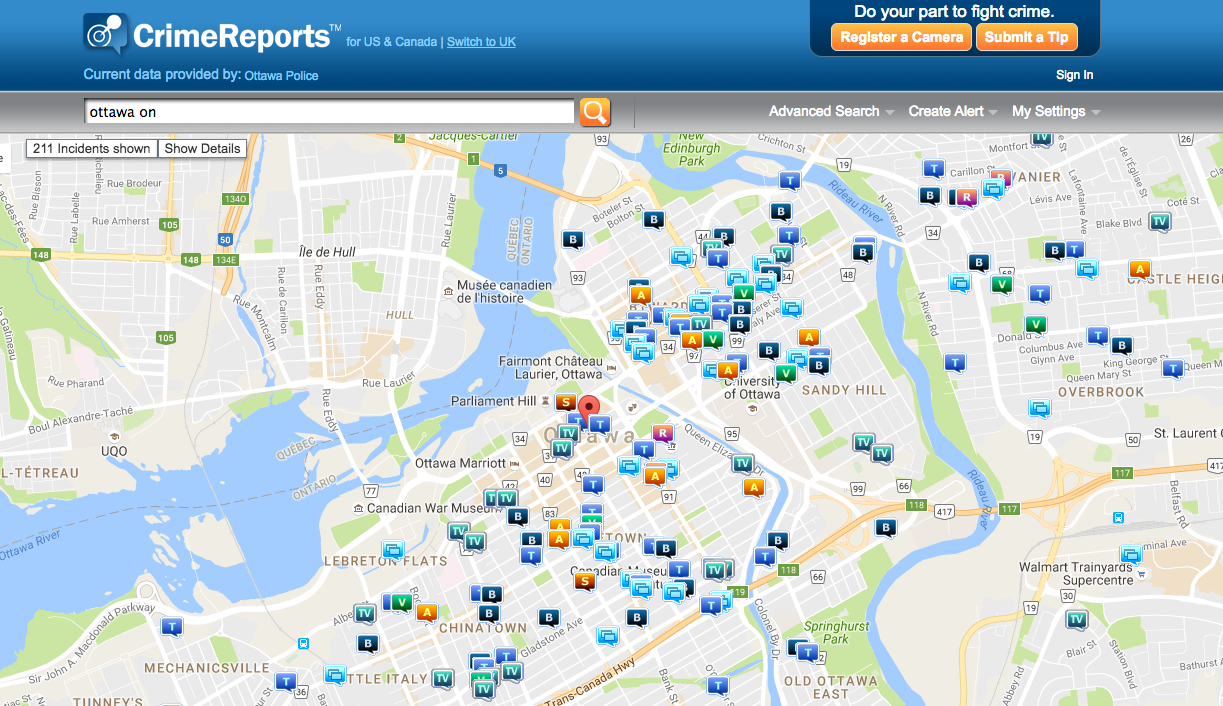
Teresa Scassa, a law professor at the University of Ottawa, began to take a closer look at police crime maps as she did research into the Ottawa Police Service’s sexual assault data. Looking specifically at crime maps provided by police services in Ottawa, London, Ont, and Saint John, New Brunswick, Scassa wrote in her paper “Police Service Crime Mapping as Civic Technology: A Critical Assessment”, which appears in a recent issue of the International Journal of E-Planning Research, that the data provided is, “relatively poor quality; it is incomplete, potentially inaccurate, and presented in ways that can be misleading.”
Police services can decide what kind of data they want to plot on the map, and what they don’t, noted Scassa, painting only a partial picture of what crime looks like in any given neighbourhood. “You might search in a city that doesn’t provide sexual assault data to find out how many sexual assaults there been in the city in the last 30 days and the result will be none,” Scassa said. “And you think, ‘Wow this is a great city.’” But in reality, the data simply hasn’t been provided. Of the police services Scassa looked at, only the OPS provides sexual assault data.
Some of the issues that Scassa found while looking at the crime maps include:
- The data on the maps is “police call data”—aka 911 or emergency response calls. Sometimes multiple calls will come in about one incident, or a reported incident will turn out to be much more minor than originally reported.
- The data doesn’t provide the specifics needed to get the whole story. In her research Scassa points out that a reported assault may have been in reality a heated shouting match with no resulting criminal charges.
- If you were to look at some maps, on first glance it might appear that crime is rampant. But, as Scassa points out, what you might actually be looking at is bylaw infractions—tickets for panhandling or sleeping in public.
- Maps are plotted to the nearest street at block level. As a result, large public spaces like parks don’t have crime reports accurately plotted. Any crime reported in those areas is instead plotted to the nearest block, making the park look like it is crime free while the surrounding area is crime ridden. “That’s potentially misleading to the public as well, but also in terms of that neighborhood, possibly problematic representation of the nature and degree of crime in the streets around,” said Scasa.
- Ottawa, London and Saint John all use American GIS crime mapping software rather than customized maps. This creates an issue since the software is formatted to report American crime statistics, which vary from Canadian ones. The OPS notes on its website the limitations of this data, but if you access it from the American website, you wouldn’t find the same disclaimer and could be misled by the map you are viewing. Scassa also notes that since the map isn’t customized, police services can’t add data at the public’s request.
Despite the problems with these data sets, reporters often rely on them because they are the only data available. Scassa found that police forces often will release crime maps in lieu of raw data that journalists and the public could use to formulate their own maps.
April Lindgren, a professor at Ryerson University who has studied how police information units shape local coverage, says that this is just one of the ways that police forces across Canada have found ways to control the narrative. As newsrooms get smaller, police departments have better funded and larger public relations machines that can overwhelm news outlets with information.
“We’ve seen a big growth in police budgets in particular that have allowed them to staff up, build up their public affairs units and get their message out at the same time as we’ve got news organizations where reporters are increasingly having to scramble to get information,” Lindgren said.
The speed that people need to get stories up online also often plays to the police’s favour. “(In) quite a lot of stories you see the police as the only source in the story,” said Lindgren.
“It does raise some interesting questions about our practices as reporters,” Lindgren added. “I mean, how many other stories would we do where we have a single source and we never check on anything?”
One possible solution to this problem is simply for police services to release raw data sets so that anyone can look at them and use them. Scassa said that the Vancouver Police Department releases the data that they use to build their own customized crime maps.
“I do think both the customized platform is interesting, but also taking that same data and making available as open data is a very positive development,” said Scassa.
Correction: The original version of this story incorrectly spelled Saint John, New Brunswick. We apologize for the error.
H.G. Watson can be reached at hgwatson@j-source.ca or on Twitter.
H.G. Watson was J-Source's managing editor from 2015 to 2018. She is a journalist based in Toronto. You can learn more about her at hgwatson.com.