
Since March 2020:
53 outlets have closed permanently (41 community newspapers, 5 radio stations, 4 online sites, 2 television stations and 1 magazine) while 16 outlets have reopened after temporarily closing (15 community newspapers and 1 daily newspaper)
51 outlets — 31 community papers, 15 daily papers and 5 magazines —have cancelled some or all print editions. At this point we do not have data on the number of publications that have returned to previous print service levels.
183 outlets have reported layoffs or job losses. 17 companies with multiple media holdings also reported layoffs or job losses, but have not provided details about which outlets are affected.
3,023 editorial and non-editorial jobs have been cut temporarily or permanently. To date, we have confirmed 1,281 permanent job losses. The status of many of the remaining layoffs is unclear. In some cases, employees have been rehired, in other cases it is undetermined whether layoffs are permanent or temporary.
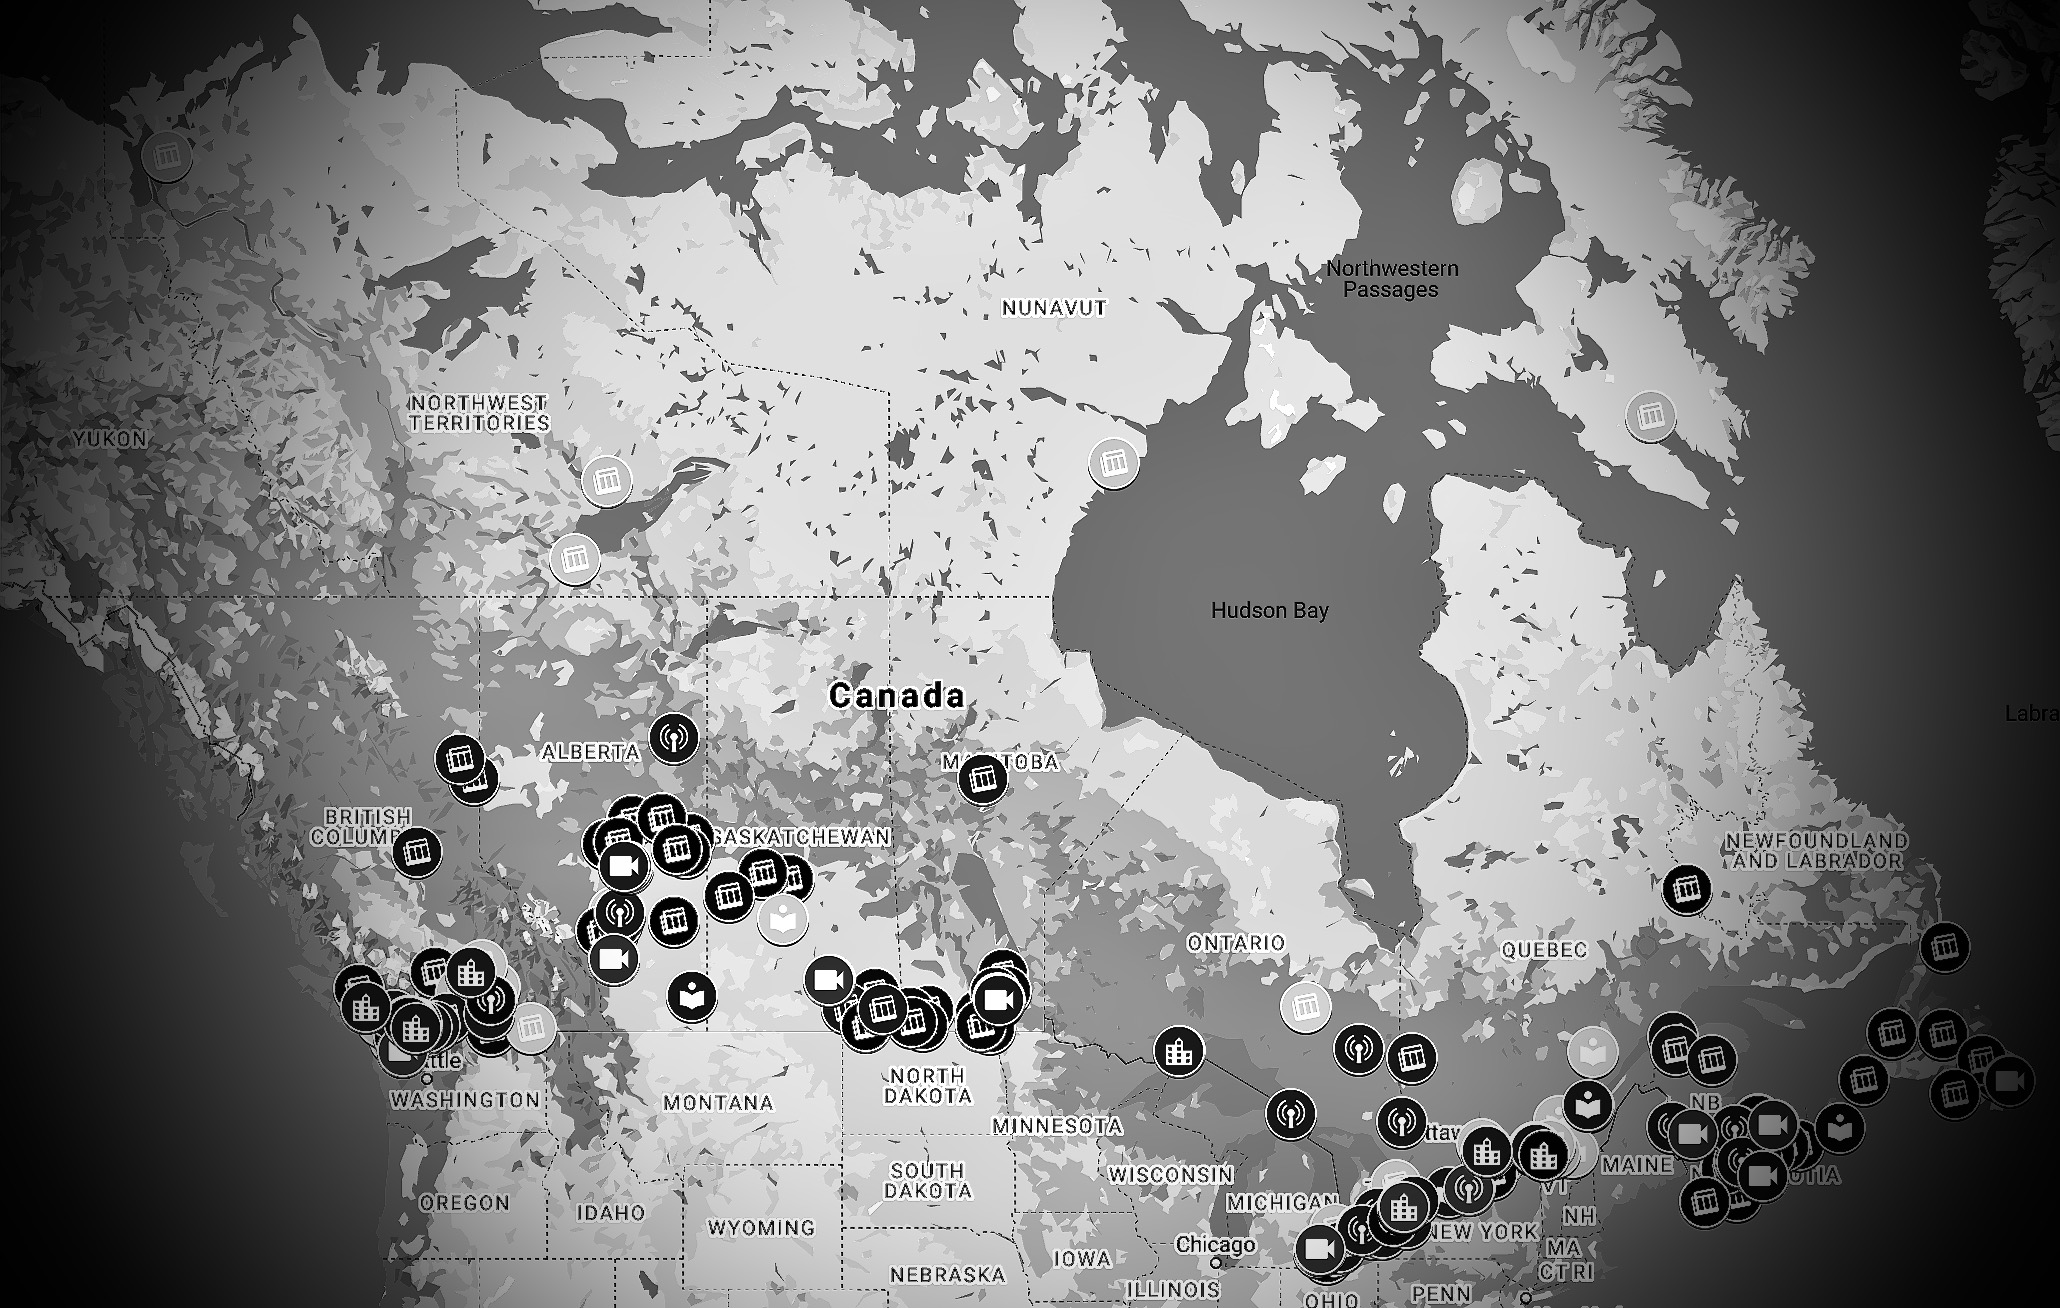
The COVID-19 Media Impact Map for Canada tracks the impact of COVID-19 on media outlets in Canada after March 11, 2020, when the World Health Organization declared a global pandemic. The information boxes accompanying map markers are regularly updated to reflect the evolving situation on the ground.
This report, the eighth since we launched the map in the spring of 2020, includes an expanded section with more detail on media organization closures. The report now includes a new table that breaks down the data to show the number of permanent closings and the number of outlets that closed temporarily but subsequently re-opened. In addition to the table, we’ve included a list of media outlets in each category.
We anticipate doing at least one more update by spring 2022. Considerations that shape our discussions around continued tracking of the pandemic’s impact on news operations include updating previously incomplete data and uncertainty about what will happen to company balance sheets as government financial support winds down.
Some media companies have been drawing on the Canadian Emergency Wage Subsidy program for financial assistance. In its latest quarterly filing, for instance, Postmedia Network Canada Corp. reported receiving a total of $63.3 million from the program since its inception. This included $23 million in wage subsidies for the year ending Aug. 31, 2021 and $40.3 million in the previous year. Postmedia’s net earnings in 2021 were $33.7 million, as compared to a loss of $16.2 million in 2020. CEWS was replaced in October by the Canada Hiring Recovery Program, which will run until May 2022.
It is unclear the extent to which smaller, privately held news operations tapped CEWS or what the bottom lines of companies will look like when all of the COVID 19-support programs are terminated. The COVID-19 Media Impact Map for Canada, we hope, will provide some insight into these matters in the coming months.
The data we have assembled on layoffs since March 2020 are available here. There are now 288 markers on the map representing pandemic-era change throughout the media industry.
The COVID-19 Media Impact Map for Canada is a project of J-Source, the Local News Research Project at the School of Journalism at X University (also known as Ryerson) and the Canadian Association of Journalists. Cuts sourced through news reports, company statements and our own reporting have been used to create each marker. For large companies, in many cases it is not clear from the information available which divisions, publications or programs have been affected so we have mapped the changes to the head office location and the specific outlets where there is known impact. As a result, the number of news organizations affected by COVID-19 are underrepresented on the map. For more information, visit the LNRP’s website.
The project team is verifying tips about the effects of the pandemic on an ongoing basis. Confirmed reports will be reflected in subsequent updates. If you’re aware of a new cut or have additional knowledge of a previous one, get in touch at info@j-source.ca or fill out the form COVID-19: Impacts on media in Canada.