

Government, industry and philanthropic responses to the decline and disappearance of local news in Canada need to be informed by robust empirical data. Yet, some have pointed to what they say are conflicting narratives about the state of community newspapers in Canada.
The supposedly duelling data consists, on one hand, of information on community newspapers published by News Media Canada, an industry association representing daily and community newspapers. A comparison of NMC’s annual list of community newspapers since 2011 suggests the number of titles hasn’t changed much. On the other hand, data from the Local News Map show that over the same period time there has been a net loss of 270 community newspaper titles. So what is going on?
First and foremost, the data are at odds because they measure different phenomena. The Local News Map tracks the opening and closing of community newspapers. NMC’s annual snapshot of existing community newspapers is just that — a snapshot of existing publications at a point in time.
“At the end of the day we are operating with different data sets, which makes any comparisons problematic,” Kelly Levson, NMC’s director of marketing and research, said in an email.
Moreover, she added, ongoing database updates and the challenges of information gathering for publications that are not members of News Media Canada mean the NMC data cannot — and should not — be used for year-over-year comparisons of the number of publications.
The Local News Map data
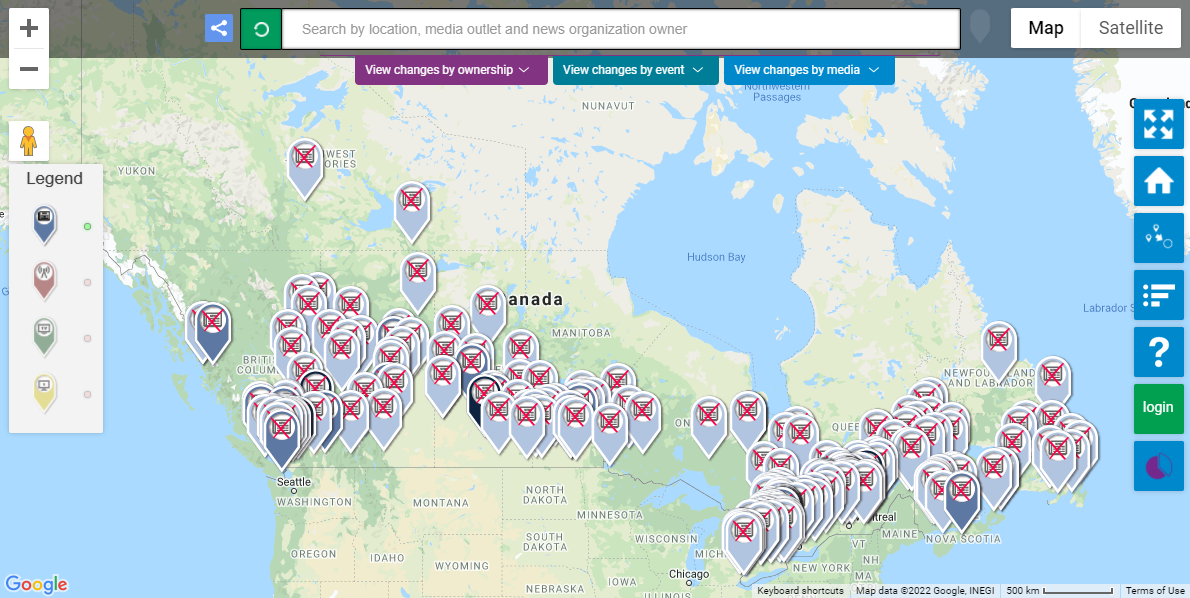
The Local News Map is a crowd-sourced resource that tracks what is happening to local newspapers, broadcast outlets and online/digital news sources in communities across Canada. It displays data going back to 2008, which marked the beginning of a deep recession and a turning point for many previously profitable local news organizations. Every two months, the Local News Research Project produces a report summarizing the information available on the map as well as a spreadsheet of the raw data.
The Local News Map displays markers that represent changes to:
- free local daily newspapers
- paid subscription local daily newspapers
- community newspapers (published fewer than five days per week)
- local private/public radio stations
- local private/public television stations
- online/digital local news sources, including online radio stations, newsletters, web-based digital news sites and other online formats as they emerge
The following types of changes to local news operations are recorded on the map:
- the closing or launch of a news outlet
- service improvements such as a new or extended local television newscast
- service reductions such as a reduction in the number of times a newspaper publishes per week
- mergers of local news outlets that result in the launch of a new entity and/or the closing of an existing news operation
- local free daily newspapers that become community newspapers
- local paid-subscription daily newspapers that become community newspapers
- local news operations that shift to making content available online only
A local news organization for the purposes of the Local News Map is defined as a news outlet that maintains independence from those it covers, demonstrates a commitment to accuracy and transparency in reporting methods, and is devoted primarily to reporting and disseminating timely, originally produced news about people, places, issues and events in a defined geographic area.
The information that registered users add to the map about changes to local media outlets is displayed using color-coded markers. Researchers responsible for the map also regularly add markers. When map users click on a marker, a pop-up box displays the name and owner of the news outlet along with information on what changed, the community name, when the change occurred, language of operation and links to the sources of information about the change. The map also allows users to filter the markers by news outlet ownership, media type and type of change.
To ensure the accuracy of map data, the Local News Map team verifies each crowd-sourced submission – a relatively manageable activity since fewer than a dozen markers are usually added each month. The verification process involves reviewing the news organization’s website, doing online searches for information to confirm what happened, and reviewing the content of any links accompanying crowd-sourced submissions. One or more links to sources are included in the pop-up boxes associated with each marker so that users can see for themselves the information used to verify what happened. Finally, journalists, researchers, students, media owners, community members and other map users are quick to point out errors and in doing so contribute to quality control.
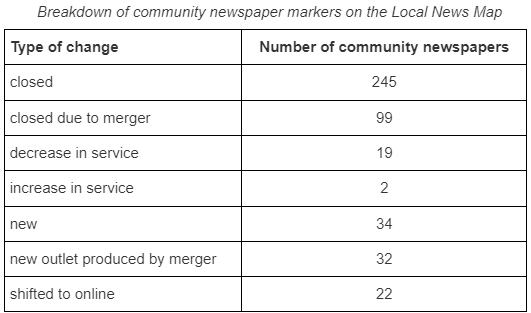
For the period 2008 to Feb. 1, 2022, the map documented 344 community newspaper closings/closings due to merger and the launch of 66 new community newspapers/new community newspapers produced by mergers, for a net loss of 278 publications.
The News Media Canada data
News Media Canada produces a newspaper industry Snapshot report each year that includes data on community newspapers. The Snapshots show that the number of community papers jumped significantly between 2009, when the list included 778 titles, and 2011, when NMC listed 1,042 titles.
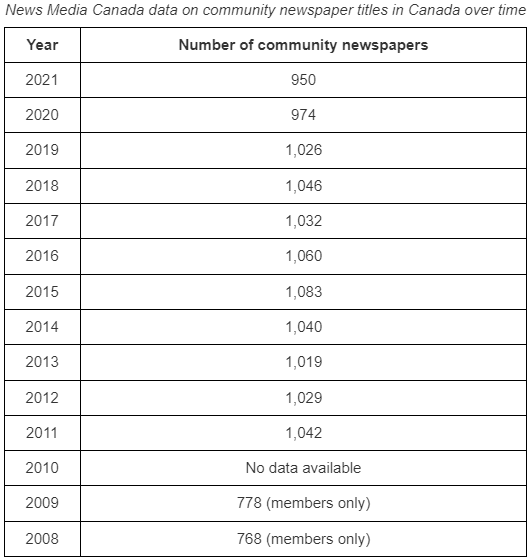
Levson said the jump in numbers occurred because NMC started including non-member community newspapers in its annual list for the first time that year. This generates a more complete picture of the sector. But the challenges of gathering timely information on non-member publications makes year-over-year comparisons problematic for the reasons outlined below.
A tale of two data sets
According to the 2021 NMC Snapshot, there were 950 community newspaper titles in Canada last year, a decline of 92 titles between 2011 and June 30, 2021. Over the same decade, the Local News Map data show that 334 community newspapers closed while 64 launched for a net loss of 270 titles.
The two sets of data appear to tell different stories, but appearances in this case are misleading. The stories are different because the data are different. The Local News Map tracks changes to community newspapers – the launch or closing of a publication, for instance. NMC’s Snapshot reports are annual lists of existing publications pulled from the association’s industry database.
“The Snapshot documents were never meant to be trending documents on industry changes,” Levson says. “They are truly a snapshot of the industry at that point in time, based on the best available data that we can source.”
More specifically, the two data sets differ because:
- NMC’s Snapshot in 2011 included some, but definitely not all, non-member newspapers that existed at the time. That’s because finding those publications – many are small and don’t have much of an online presence – is difficult. Community newspapers that weren’t included in the 2011 list have been added to NMC ‘s annual Snapshots in the year that they came to the industry association’s attention. This has shored up the number of publications in the years since 2011.
- Levson says NMC’s yearly Snapshots also likely include some titles that have ceased to exist following the release of the annual list. “The problem we have always struggled with is that many newspapers (most non-members) don’t advise us of changes,” she added. “So our database reflects our best efforts, which is by no means exhaustive.”
- News Media Canada defines a community newspaper as a paper that publishes a hard copy edition fewer than four times per week. For the Local News Map, papers that publish fewer than five times a week are considered community newspapers.
- The Local News Map may include information on the closing/launch of community newspapers that has never been included in News Media Canada’s database because of the challenges of information gathering for non-member publications.
Looking ahead
The Local News Map’s findings and News Media Canada’s annual industry Snapshots do not exist in a vacuum. Levson, for instance, is part of the Local News Map “crowd” in that she passes on information about the closing of community newspapers when they come to her attention.
Both data sets are also useful to policy makers, industry analysts and researchers in different ways. It might be possible, for instance, to start pinpointing actual news deserts in Canada by mapping NMC’s most recent list of community newspapers, its comparable data on dailies, and the location of broadcast outlets and local digital news operations available from other sources.
The Local News Map data, meanwhile, can be used to investigate whether changes in the availability of local news are associated with reduced voter participation or other indicators of local democratic engagement. The map data can be used to explore the characteristics of locations that have lost or gained a news organization and analyzed to identify what types of media outlets are closing, what types are being launched and the types of ownership involved.
All of these are valid avenues of inquiry. Using one of these data sets to discredit the other is not.
April Lindgren is a professor at X (also known as Ryerson) University’s School of Journalism and principal investigator for the Local News Research Project. Her research investigates local news poverty and the role of local journalism as critical community infrastructure. She spearheaded creation of the crowd-sourced Local News Map, which tracks changes to local news ecosystems.
Christina Wong is the data analyst, GIS technician and website administrator for the Local News Research Project and the Local News Data Hub. She has a Bachelor of Arts in Geographic Analysis from X (also known as Ryerson) University.
This post was originally published by the Local News Research Project.