
Earlier this year, friends and colleagues Zach Gallinger and Arik Motksin launched 10and3, a site dedicated entirely to telling stories through data.
[[{“fid”:”4567″,”view_mode”:”default”,”fields”:{“format”:”default”,”field_file_image_alt_text[und][0][value]”:””,”field_file_image_title_text[und][0][value]”:””},”type”:”media”,”link_text”:null,”attributes”:{“height”:444,”width”:856,”style”:”width: 399px; height: 207px; margin-left: 10px; margin-right: 10px; float: right;”,”class”:”media-element file-default”}}]]By Chantal Braganza, Associate Editor
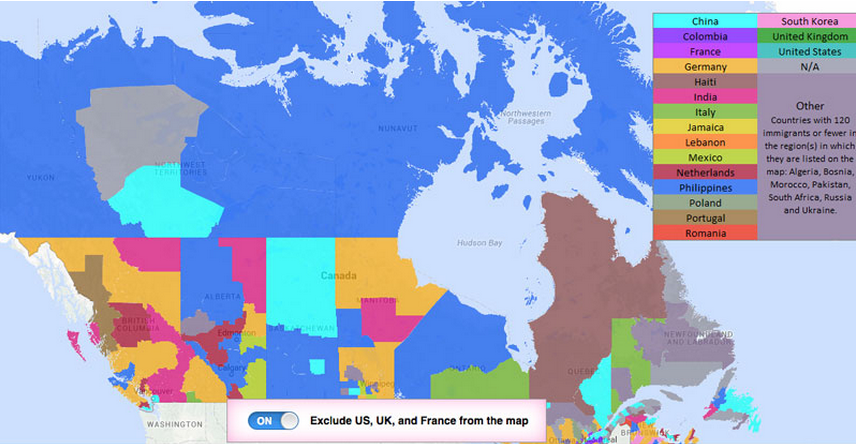
Earlier this year, friends and colleagues Zack Gallinger and Arik Motskin launched the 10 and 3, a site dedicated entirely to telling stories through data. With a team of writers, the data analyst and statistician have analyzed how much Canadian spend on alcohol, mapped where most communities of newcomers to Canada end up, and determined which universities in the country employ the most professors in math and science disciplines who are women.
We spoke to the site’s co-founder, Arik Motskin, about the site’s launch, their data methodologies and what kind of information makes for great stories.
J-Source: What got an idea for a news site like this off the ground?
Motskin: About a year ago, my colleague and friend Zack and I were talking about the fact that we share a lot of the same interests—news, statistics, sports—and we were comparing the publications we read online. We’re big fans of sites like FiveThirtyEight, Vox and Slate. And we’re both Canadian and grew up in Toronto. And we talked about while to some extent there are projects like this happening in Canada, none seemed to stand out as large-scale projects in national scope. They either live as sections of a news site or are local in scope, or happen intermittently—once a month or so.
We thought there were plenty of stories not being told by data, so we tried to see if we could work on something like this. It launched in January with Zack and I, and a couple of other people. We did a lot of the research, writing, and analytics, and a small team of people to pitch in and help us.
We got a lot of readers interested in our first post from January, looking at where hockey players have come from across Canada through the years since the 1920s. Readers were excited about it because it was a new way of looking at the data of where hockey payers come from.
J-Source: Where does the name come from?
It’s the number of provinces and territories in Canada. We wanted some mathematical or analytical way of summarizing the country.
J-Source: The people on your editorial team come from a lot of backgrounds: statistics, IT, data analysis.
Motskin: Mine is in mathematics and stats. I do a lot of writing and speaking in my role, but I don’t have a traditional journalism background, and neither does Zack who comes from business and economics. What we’ve observed is that in journalism in general, and the population at large, is that people don’t understand numbers that well. They don’t understand data that well. They don’t know what to make of it—and are a little afraid of it.
I know it’s getting more common to look at data more, and presenting it in interesting ways. But I think we bring a little rigour and experience to it. So far our visualization ideas have been really strong. People like math when it’s represented in a really elegant way. But the hardest part about it still: identifying the story, and finding the best way to present it.
J-Souce: What kinds of skills or tools do you find are necessary, and/or not very common, for identifying stories in data?
I think a lot of basic things. When you look at a data set, it’s a big table of numbers. You have to know what these numbers tell you. Do they tell you anything?
Or say that you see an upward or downward trend in crime. Someone might look at murder rates from 2012 to 2015 in Toronto and see dipping murder rates. It’s dangerous to assume outright that this conclusion is concrete. There can be a lot of noise in the data. You can do a lot of statistical testing methods that can help identify whether the trend is real. So, you need to know how to think about the data in that regard.
So, you need to know how to think about data. And later on, how to you prove or disprove it.
J-Source: Where do you typically go to for the data sets that inform your story ideas?
Motskin: We’ve used several sources. The first place you might look depending on your stories could be Stats Canada. They certainly have a lot of great data, and it’s good structured data. But it’s hard to search for: its site is not structured well, and there are limitations. The long-form census is no longer involuntary, so the data is less meaningful.
There’s a lot of structured data out in the world that’s useful. Sports has a lot of its that’s open-access. But the most interesting data source, and it’s interesting in that you’re the only one to get it, is what you collect on your own.
We recently collaborated with a writer on craft beer in Ontario and Quebec. We wanted to show how many breweries have opened, so we had to scour several business listings and databases and combine those together to make a proprietary dataset of our own. It’s a lot of work, but you’re making something new.
J-Source: How much of your time does the site take up right now?
Motskin: It’s not full-time at the moment. We have full-time jobs outside of this, so it’s definitely a passion project. That in and of itself has limited the volume of content we put out.
Right now we’ve been in head-down mode and put out as much quality stories as we can. We’ve already doubled the number of people we work with. We’d like to work with more. Ultimately our goal is to have more people come to our site to develop new and interesting stories and publish more frequently. And develop a steady readership.
J-Source: On the money side of things, what does the 10and3’s financial model look like? Do you pay writers?
In terms of the site’s infrastructure, it’s fairly inexpensive these days. That’s out of our pockets and not a big deal. We’re essentially working for free, and it’s a passion project at this point.
We do have ads on our site and pay writers a portion of the revenue that’s generated from that. Ads don’t make a huge amount of money, but we find that the people who work with us do so because they enjoy what we’re doing.
And a lot of folks who work in journalism and don’t have a data or mathematical background want to learn; so I think they’re enjoying learning from us. And we’re enjoying learning from them, too.
This interview has been condensed and edited.
Note: This story has been updated to correct an error in the spelling of Zack Gallinger’s name, and the provinces included on a story on craft beer in Ontario and Quebec.